Global Risk Analysis
The Global Risk Analysis widget is an interactive map showing the following data for the selected time frame:
-
Traffic Trend: Percentage change in the number of transactions
 An executed business process that is associated with an account. The transaction applies credentials for the account to a workflow and contains the decision rendered by the workflow. processed through Jumio over the same time frame from the previous year.
 -
Reject Rate: Percentage change in the number of transactions rejected over the same time frame from the previous year.
-
Approval Rate: Percentage of transactions from all countries that were approved.
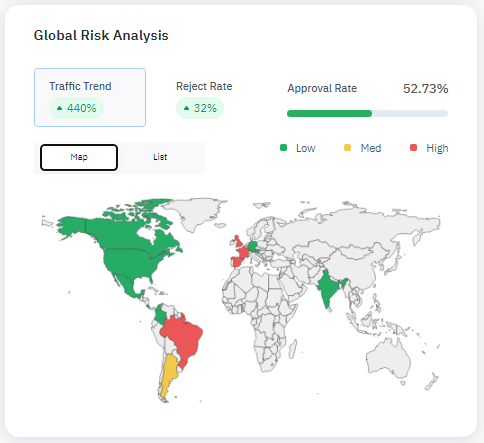
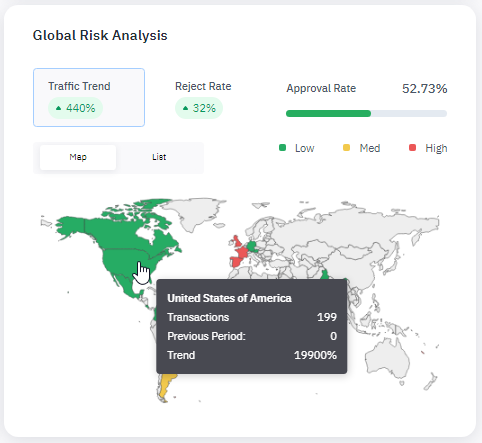
Click the Traffic Trend or Reject Rate data field to show related data on the map.
With Traffic Trend selected, hover your pointer over the map to view a country’s total transactions for the current and previous periods (the same time frame from the previous year) as well as the trend, or percentage change between the two.
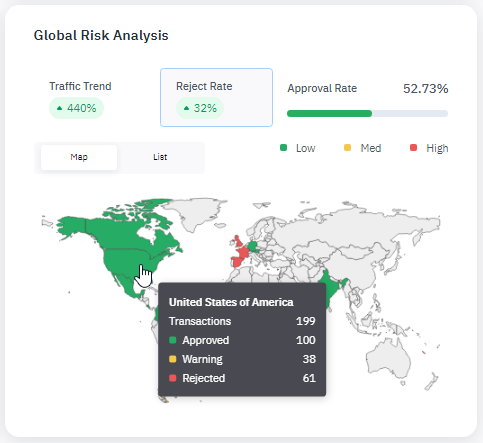
With Reject Rate selected, hover your pointer over the map to view a country’s total transactions for the current period as well as the number of transactions assigned each risk score.
To view the data as a list of countries, click the List toggle. This will reveal the traffic trend or reject rate for each country for which data exists.
